
Wind Probabilities--An Important New Threat Assessment Tool
Part 3 of 3 - Applying Cumulative Wind Speed Probabilities from HurricaneMapping
Cumulative wind probabilities have recently been added to HurricaneMapping's shapefile-format feed of tropical cyclone advisory datasets. You'll find that all of HurricaneMapping's new advisory datasets (beginning with Hurricane Noel late in 2007) contain 3 relevant shapefiles--Probs_34kt.shp, Probs_50kt.shp, and Probs_64kt.shp.
HurricaneMapping's wind probability shapefiles contain polygons representing 5 ranges: probabilities of at least 5%, 10%, 20%, 30%, and 50% . These polygons are the result of boundary analysis performed on the TPC/NHC's gridded wind probability products. The resulting HurricaneMapping wind probability product is considerably more compact and readily interpretable than its NDFD parent product because it eliminates the need for data conversion and intensive spatial analysis. The ability of the GIS manager to rapidly perform analysis and produce maps based on a recently issued forecast advisory is critical when a hurricane is threatening.
Let's take a second look at Advisory 11 for Tropical Storm Noel using HurricaneMapping's dataset in ArcGIS. (If desired, you can download this zipped dataset of shapefiles for your own viewing in ArcGIS or other GIS program: Noel11_2007.zip)
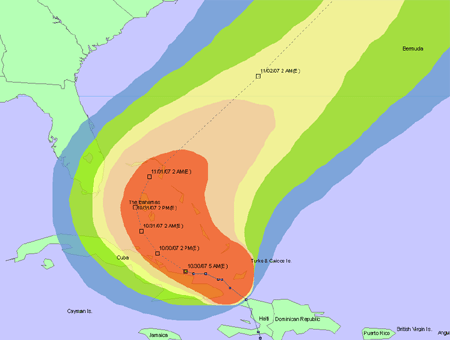
Figure 7. 120-hour cumulative probabilities for winds 34kts or greater. Probability
ranges are 5%(blue), 10%(green), 20%(yellow), 30%(pink), and 50%(red).
The probabilities illustrated above are from the longest of the 20 time frames contained within HurricaneMapping's dataset (polygons for 120-hour cumulative probabilities are always largest and obscure all others in ArcGIS's default view). One method for displaying probability polygons from any single time period is to simply enter a Definition Query (such as "HOUR"=18) under the Layer Properties. In the animation below, we see how the cumulative probabilities expand over time.
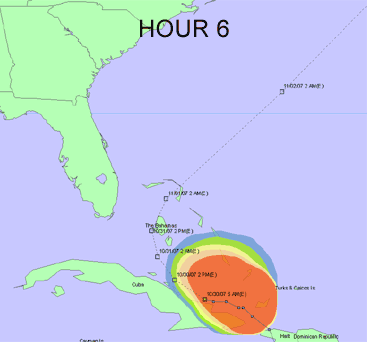
Figure 8. Cumulative probabilities over time(0-72 hours) for winds 34kts or greater. Probability
ranges are 5%(blue), 10%(green), 20%(yellow), 30%(pink), and 50%(red).
Though the NHC's official forecast projects that the storm center will not pass over or near the northern-most Bahamas for another 48 hours, winds ahead of the storm center will be felt well in advance of that time. Emergency planners typically regard the arrival of tropical storm force winds as the point by which all storm preparations should be completed. So how soon might the northern-most Bahamas begin to experience winds of tropical storm force or greater? Using the animation above, we determine the following sequence of probabilities for tropical storm force winds in the northern Bahamas:
- less than 5% chance (outside of all polygons) within the next 18 hours
- a 5% chance (blue polygon) within 24 hours
- a 10% chance (green polygon) within 30 hours
- a 20% chance (yellow polygon) within 36 hours
- a 30% chance (pink polygon) within 42 hours
What is your organization's risk tolerance threshold? If your preparations take 18 hours to complete, you would probably elect to wait and see what the next forecast advisory brings, rather than acting upon odds less than 5% of tropical storm force winds arriving so soon. However, 5% odds might trigger some initial action and 10% a full-scale initiation of preparation plans.
Hopefully you are beginning to see how pre-selected probability thresholds could trigger various actions specific to your organization's hurricane response plan. Wind probabilities are well suited to help answer the difficult questions of 'Do we need to act?' and 'How long do we have before we would need to act?' And, since HurricaneMapping's wind probability products are GIS-ready, you have the capability of creating highly sophisticated and nuanced rule sets that operate within your GIS software and datasets.
_________________________________________________
Recommended outside reading: Employing Tropical Cyclone Wind Probabilities to Enhance Local Forecasts and Improve Guidance for Decision-Makers.
Want to initiate or join a discussion on wind probabilities? We're interested in hearing what sorts of probability-based rule sets you might develop for your community. Please visit our HurricaneMapping Users Group to get started.
<<< Part 2 - Derivations and Formats for Wind Probability Products